How to Build a DevOps Dashboard for Real-Time Analytics

Master building a real-time DevOps dashboard. Our in-depth guide covers architecture, tools like Grafana & Prometheus, best practices, and use cases to boost your team's efficiency and system reliability.
Let's be honest. The life of a DevOps engineer, SRE, or developer in a modern tech stack can feel like trying to drink from a firehose. You’re inundated with a constant stream of data: server CPU spikes, application error rates, database query latency, container orchestration events, and deployment statuses. Logs are scattered, metrics are in different systems, and alerts... oh, the alerts. They come from everywhere, often without context.
This is where the magic of a well-constructed DevOps dashboard comes in. It’s not just a "nice-to-have"; it's the central nervous system for your engineering team. It transforms raw, chaotic data into a coherent, visual story about the health and performance of your systems.
In this comprehensive guide, we’re not just going to talk about why you need a dashboard. We’re going to roll up our sleeves and dive deep into how to build one for real-time analytics. We'll cover the architecture, the popular tools, a step-by-step implementation plan, best practices, and real-world use cases.
To learn professional software development courses such as Python Programming, Full Stack Development, and MERN Stack, visit and enroll today at codercrafter.in. The principles we discuss here are foundational to the skills we teach.
What is a DevOps Dashboard? (Beyond the Pretty Graphs)
At its core, a DevOps dashboard is a single pane of glass that aggregates and visualizes key metrics and logs from every layer of your application and infrastructure stack. Its primary purpose is to provide real-time situational awareness.
Think of it as the control panel for a spaceship. The pilot doesn't need to check the engine's oil level manually or count the oxygen canisters. They have a dashboard that shows fuel levels, hull integrity, life support, and navigation—all at a glance. A DevOps dashboard does the same for your software systems.
Key Characteristics of an Effective Dashboard:
Real-Time (or Near-Real-Time): Data is updated within seconds, allowing you to see the impact of a deployment or a traffic surge as it happens.
Centralized: It pulls data from disparate sources (servers, databases, applications, networks) into one unified view.
Actionable: It doesn't just show data; it provides context that leads to decisions. A spike in error rates is directly correlated with a recent deployment marker on the same graph.
Hierarchical: It offers high-level overviews for managers and deep-dive views for engineers troubleshooting a specific microservice.
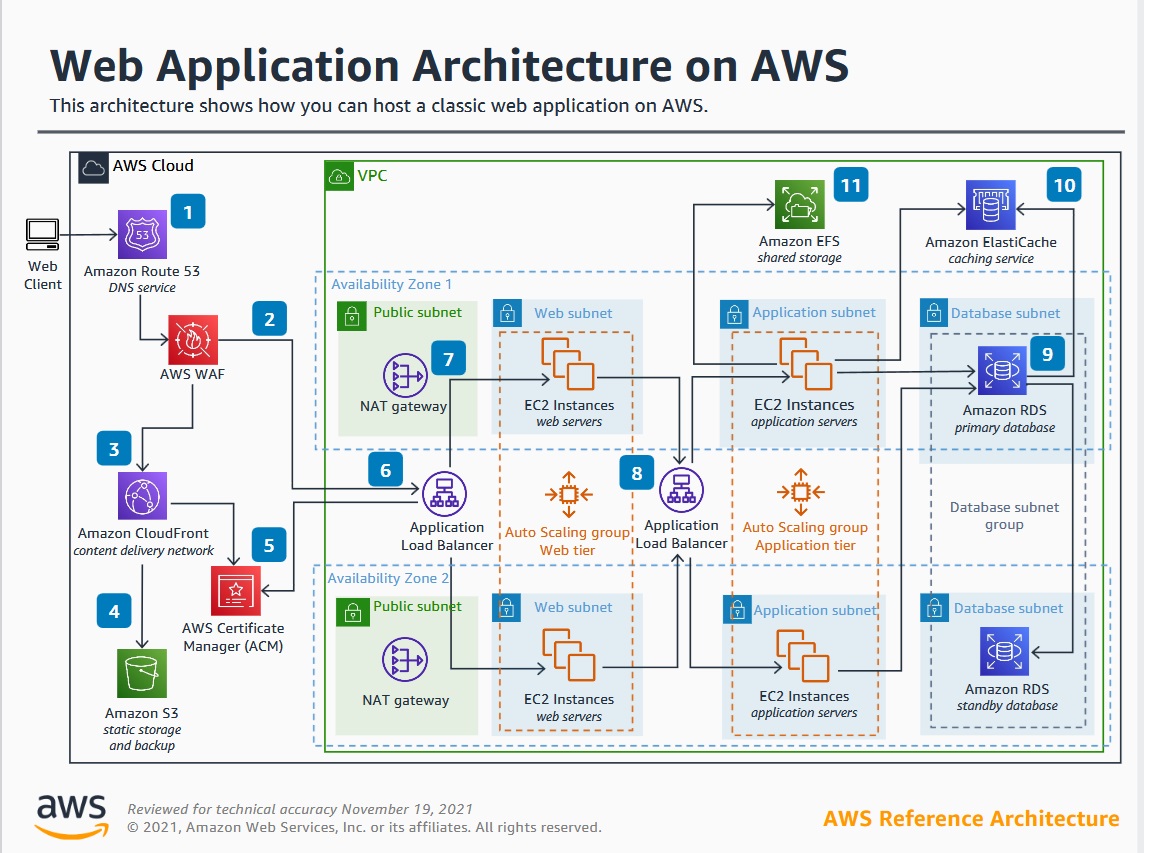
The Building Blocks: Anatomy of a Real-Time Analytics Dashboard
Before we write a single line of code, it's crucial to understand the architectural components involved. A typical pipeline looks like this:
Data Sources: This is where your data originates.
Infrastructure: CPU, memory, disk I/O, network usage (from servers, VMs, Kubernetes pods).
Application: Application errors, request rates, response times (latency), business transactions.
Network: Bandwidth, connection counts, error rates.
Database: Query performance, number of connections, replication lag.
Synthetic Monitoring: Uptime checks from external locations.
Data Collection & Exporting: Agents or libraries that gather the data from the sources.
Prometheus Node Exporter: For infrastructure metrics.
OpenTelemetry (OTel): A vendor-agnostic standard for collecting application traces, metrics, and logs.
Custom Application Code: Using client libraries to push custom business metrics.
Time-Series Database (TSDB): The specialized database that stores all the metric data. Time-series data is unique because it's a stream of data points indexed by time. TSDBs like Prometheus, InfluxDB, and TimescaleDB are optimized for this.
Example:
server_cpu_usage{server="web-01"} 75.6 1719501234
Logging Aggregator: While metrics give you the "what," logs give you the "why." A centralized logging system like Loki, Elasticsearch (ELK Stack), or Splunk is essential for digging into errors.
Example:
ERROR 2024-06-27 10:30:15,894 [http-nio-8080-exec-5] c.e.c.Controller - Database connection timeout for user ID 12345
Visualization & Alerting Layer: This is the dashboard itself. Tools like Grafana or Kibana connect to the TSDB and logging aggregator to create visualizations. They also handle alerting based on defined thresholds.
Alert Manager: A component (often used with Prometheus and Grafana) that deduplicates, groups, and routes alerts to the correct channels like Slack, PagerDuty, or email.
The Toolbox: Popular Technologies for Your Dashboard
You don't need to build everything from scratch. The DevOps community has created a powerful ecosystem of open-source and commercial tools.
The Prometheus Stack: The de-facto standard for Kubernetes and cloud-native environments.
Prometheus: The time-series database and collection engine.
Grafana: The visualization powerhouse. It can query Prometheus and many other data sources.
Alertmanager: Handles alerts from Prometheus.
The TICK Stack: From InfluxData.
Telegraf: The agent for collecting metrics.
InfluxDB: The time-series database.
Chronograf: The visualization tool (though many use Grafana with InfluxDB).
Kapacitor: The alerting and processing engine.
The ELK/Elastic Stack: Fantastic for logging.
Elasticsearch: The search and analytics engine.
Logstash: The server-side data processing pipeline.
Kibana: The visualization tool for Elasticsearch.
Grafana Loki: A horizontally-scalable, highly-available, multi-tenant log aggregation system inspired by Prometheus. It's often used alongside Prometheus and Grafana for a unified metrics-and-logs experience.
Commercial Solutions: Datadog, New Relic, Splunk, and Dynatrace offer all-in-one SaaS solutions that are easier to set up but come with a cost.
For this guide, we'll focus on the most popular open-source combination: Prometheus + Grafana + Loki.
Hands-On: A Step-by-Step Guide to Building Your Dashboard
Let's build a simple yet powerful dashboard for a web application. We'll assume a microservices architecture running on a couple of virtual machines.
Step 1: Define Your Key Metrics (What to Measure?)
You can't build a dashboard without knowing what to show. Start with the Four Golden Signals of Monitoring, popularized by Google's SRE book:
Latency: The time it takes to service a request. (Differentiate between successful and failed requests).
Traffic: How much demand is placed on your system? (e.g., HTTP requests per second, concurrent users).
Errors: The rate of requests that fail. (e.g., HTTP 5xx status codes, application exceptions).
Saturation: How "full" your service is. (e.g., CPU utilization, memory usage, disk I/O).
Additional Metrics:
Business Metrics: User sign-ups, orders per minute, payment success rate.
Database Metrics: Query latency, active connections, deadlocks.
Client-Side Metrics: Page load time, front-end JavaScript errors.
Step 2: Instrument Your Application and Infrastructure
Infrastructure with Node Exporter:
The Prometheus Node Exporter is a daemon that exposes hardware and OS metrics. Install it on all your servers.
bash
# Example for a Linux server
wget https://github.com/prometheus/node_exporter/releases/download/v1.7.0/node_exporter-1.7.0.linux-amd64.tar.gz
tar xzf node_exporter-1.7.0.linux-amd64.tar.gz
cd node_exporter-1.7.0.linux-amd64
./node_exporter &
It will now expose metrics on http://your-server-ip:9100/metrics.
Application with OpenTelemetry:
Let's instrument a Python Flask app. First, install the packages:pip install opentelemetry-api opentelemetry-sdk opentelemetry-exporter-otlp
Here's a simplified example:
python
from flask import Flask
from opentelemetry import trace
from opentelemetry.sdk.trace import TracerProvider
from opentelemetry.sdk.trace.export import BatchSpanProcessor
from opentelemetry.exporter.otlp.proto.http.trace_exporter import OTLPSpanExporter
from opentelemetry.instrumentation.flask import FlaskInstrumentor

app = Flask(__name__)

# Initialize tracing
trace.set_tracer_provider(TracerProvider())
tracer_provider = trace.get_tracer_provider()
tracer_provider.add_span_processor(BatchSpanProcessor(OTLPSpanExporter()))

# Instrument the Flask app
FlaskInstrumentor().instrument_app(app)

@app.route("/")
def hello():
    with trace.get_tracer(__name__).start_as_current_span("hello-endpoint"):
        return "Hello, DevOps Dashboard!"

if __name__ == "__main__":
    app.run(host='0.0.0.0', port=5000)
This code sends trace data to an OTLP collector, which can then be forwarded to Prometheus or a backend like Jaeger. Understanding how to instrument code like this is a core skill of a modern developer. To master these advanced concepts in Python and full-stack development, check out the project-based courses at codercrafter.in.
Step 3: Set Up the Backend (Prometheus & Loki)
Prometheus Configuration:
Create a prometheus.yml file to tell Prometheus where to scrape metrics from.
yaml
global:
  scrape_interval: 15s

scrape_configs:
  - job_name: 'node_exporter'
    static_configs:
      - targets: ['server01-ip:9100', 'server02-ip:9100']
  - job_name: 'python-app'
    static_configs:
      - targets: ['app-server-ip:5000']
    metrics_path: /metrics # Assuming you've exposed a /metrics endpoint
Run Prometheus: ./prometheus --config.file=prometheus.yml
Loki Configuration:
Run Loki and Promtail (the agent that ships logs to Loki). A simple docker-compose.yml can get you started quickly.
Step 4: Build the Dashboard in Grafana
Add Data Sources: In Grafana, go to Configuration > Data Sources and add your Prometheus and Loki endpoints.
Create a New Dashboard: Click the "+" icon and select "Dashboard."
Add Panels: This is where the fun begins. Let's create a panel for CPU usage.
Click "Add visualization."
Select Prometheus as your data source.
In the query editor, use a PromQL query:
100 - (avg by (instance) (rate(node_cpu_seconds_total{mode="idle"}[5m])) * 100)This query calculates the average CPU usage as a percentage across all instances over a 5-minute window.
Switch the visualization to a "Time series" graph.
Repeat for Key Metrics:
Memory Usage:
node_memory_MemTotal_bytes - node_memory_MemAvailable_bytesHTTP Error Rate:
rate(http_requests_total{status=~"5.."}[5m])Application Latency: You'd use a query based on your custom metrics, e.g.,
rate(http_request_duration_seconds_sum[5m]) / rate(http_request_duration_seconds_count[5m])
Use Logs Integration: Add a "Logs" panel and set the data source to Loki. You can now correlate a spike in errors with the relevant log lines that caused them, all within the same dashboard.
Organize and Annotate: Use text panels to add sections, and use Grafana's "Annotations" to mark deployments, making it easy to see if a code change caused an issue.
Real-World Use Cases & Scenarios
The Blameless Post-Mortem: Your dashboard is not just for real-time; it's for historical analysis. After an outage, you can replay the events leading up to it. "Ah, we see that the database connections saturated 30 seconds before the errors spiked, which was 2 minutes after we deployed the new user-profile service."
Performance Regression Tracking: A new feature is shipped. Your dashboard shows that the 95th percentile latency for the checkout service has increased from 150ms to 450ms. You can roll back immediately and investigate.
Cost Optimization: You notice that your development environment servers are consistently at 5% CPU utilization. You can right-size them or implement a schedule to turn them off at night, saving significant cloud costs.
Capacity Planning: Your traffic growth chart shows you will hit your current database's I/O limits in 60 days. This gives you ample time to plan and execute an upgrade.
Best Practices for an Effective Dashboard
Design for Your Audience: A dashboard for the on-call engineer needs deep, technical metrics. A dashboard for the CTO needs high-level business and system health KPIs.
Avoid Chart Junk: Don't clutter the dashboard with unnecessary graphs. Every panel should answer a specific, important question.
Use SLO-Based Alerting: Instead of alerting on "CPU > 90%," alert on when your Service Level Objective (SLO) is being burned down too quickly. This reduces alert fatigue.
Embrace the Red/Green Philosophy: Use color wisely. Red should immediately draw attention to a critical problem. Green should indicate normal operation.
Version Control Your Dashboards: Grafana allows you to export dashboards as JSON. Store these files in a Git repository to track changes and recover easily.
Iterate and Refine: Your first dashboard will not be perfect. Regularly ask your team: "What information did you need during the last incident that wasn't on the dashboard?"
Frequently Asked Questions (FAQs)
Q1: What's the difference between real-time and near-real-time?
A: Real-time typically implies sub-second latency. Near-real-time can have a delay of a few seconds to a minute. For most DevOps purposes, a delay of 15-30 seconds is perfectly acceptable and easier to achieve.
Q2: How much historical data should I keep?
A: It depends on your needs and storage costs. For high-resolution (per-second) data, 15-30 days is common. For long-term trend analysis, you can downsample the data (e.g., keep only per-minute averages) and retain it for over a year.
Q3: My dashboard is too slow. How can I optimize it?
A: This is a common issue. Optimize your PromQL queries, ensure you are using a performant TSDB, consider downsampling for historical data, and avoid overloading a single dashboard with too many panels that refresh too frequently.
Q4: Can I build a custom dashboard instead of using Grafana?
A: Absolutely. You can use libraries like D3.js or Chart.js to build a custom UI that fetches data from the Prometheus HTTP API. However, this requires significant development effort. Grafana exists to save you from that. If you're interested in building such complex front-end applications, our Full Stack Development and MERN Stack courses at codercrafter.in can provide you with the necessary skills.
Conclusion: From Data Overload to Informed Action
Building a DevOps dashboard for real-time analytics is a journey, not a destination. It starts with understanding what matters to your business and your users, instrumenting your systems to expose those signals, and then weaving them together into a coherent visual narrative.
A powerful dashboard does more than just monitor; it empowers teams. It fosters a culture of data-driven decision-making, enables faster incident response, and provides the visibility needed to build and maintain reliable, high-performing systems. It turns the chaotic firehose of data into a clear stream of actionable insight.
Stop flying blind. Start with the golden signals, set up a simple Prometheus/Grafana stack, and begin your journey from chaos to clarity. Your future self—and your entire team—will thank you for it.