JavaScript Errors: Don't Panic, Debug! A Friendly Guide for Developers
Feeling frustrated by JavaScript errors? You're not alone! Learn how to read, understand, and fix common JS errors with a calm, practical approach. Let's debug together!
There it is. You’ve been in the zone, fingers flying across the keyboard, building something amazing. You hit save, refresh the page, and then... nothing. Or worse, a blank screen and that little red icon in the corner of your browser.
You open the console. Bam. A wall of crimson text stares back at you. Your heart sinks a little. Is it broken? Did you mess up? Are you even a real developer?
Take a deep breath. I’m here to let you in on a secret every developer knows but rarely talks about: This is completely normal. In fact, if you aren't seeing errors, you probably aren't coding.
JavaScript errors aren't your enemies; they're actually your most brutally honest friends. They’re trying to tell you exactly what’s wrong. Our job isn't to avoid them forever—it's to learn how to listen to what they’re saying.
The Art of Reading the Error Message
The first step from frustration to fix is learning to read the error. It looks like gibberish at first, but it’s packed with clues. Let's break down a classic:
text
Uncaught TypeError: Cannot read property 'name' of undefined
    at getUserProfile (script.js:25:15)
    at HTMLButtonElement.onclick (index.html:12:45)
This isn't just shouting "ERROR!" It's telling us:
The Error Type:
TypeError. This means we're trying to do something with a value that isn't the type we expected.The Message:
Cannot read property 'name' of undefined. This is the gold. It means we tried to access.nameon something that isundefined.The Stack Trace: The
atlines. This is a breadcrumb trail! It shows us the exact journey the code took to the error. Start from the top: the error occurred insidegetUserProfile, which was called on line 25 ofscript.js, which was triggered by a button click on line 12 ofindex.html.
Armed with this, we know exactly where to start looking. 90% of debugging is understanding this message.
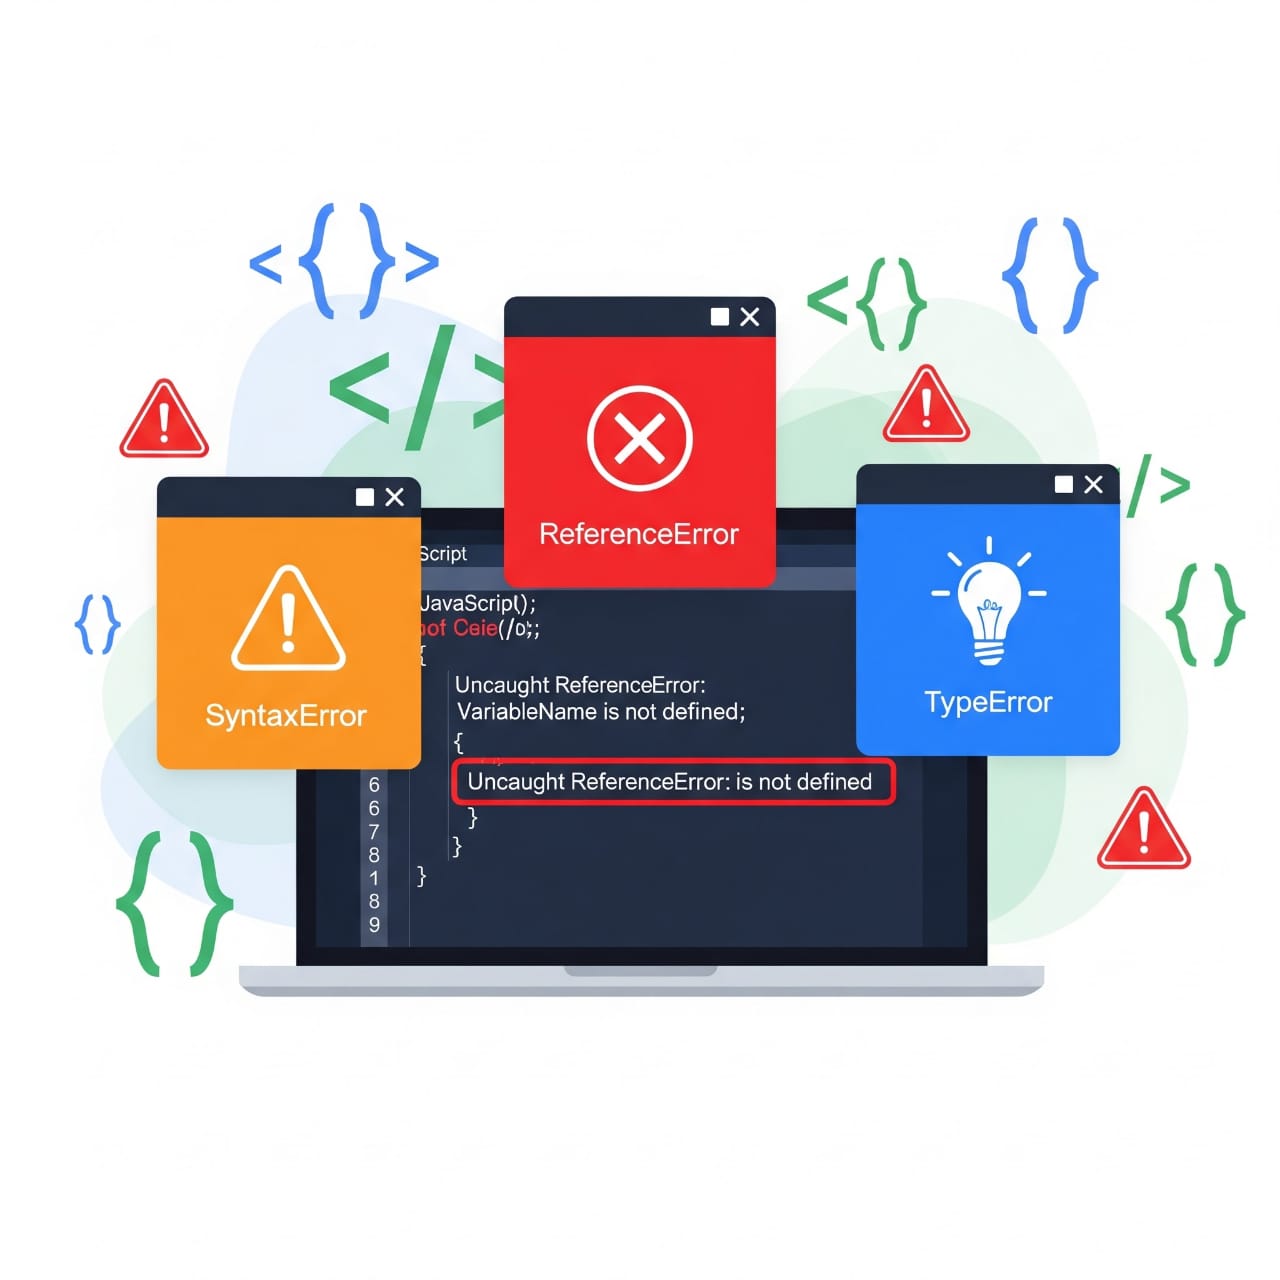
Meet the Usual Suspects: Common JS Errors
You’ll see these guys a lot. Once you get to know them, they become a lot less scary.
1. TypeError: Cannot read property 'X' of undefined/null
What it means: You're trying to access a property on a variable that is undefined or null (i.e., it holds no value).
The Fix: Check why that variable is empty. Did an API response not return what you expected? Did a function not return a value? Use optional chaining (?.) as a safety net: user?.profile?.name.
2. ReferenceError: [variable] is not defined
What it means: You're trying to use a variable that simply doesn't exist in the current scope. It’s often a simple typo (getElemetById instead of getElementById).
The Fix: Check your spelling! Also, make sure the variable is declared (let, const, var) in a scope accessible to where you're using it.
3. SyntaxError: Unexpected token
What it means: The JavaScript engine found something it didn't expect while parsing your code. You broke the language's grammar rules.
The Fix: This is often a missing bracket }, parenthesis ), comma ,, or a stray character. Your code editor's syntax highlighting will usually help you spot this.
4. RangeError: Maximum call stack size exceeded
What it means: You've written a function that calls itself infinitely—a recursive function without a proper exit condition. You've created an infinite loop, and the browser shut it down to save itself.
The Fix: Always have a base case in your recursion that stops the function from calling itself.
Your Debugging Toolkit: A Human Approach
Read the Error, Then Read it Again: Seriously. Don't just skim it. Read every word. It has the answer.
Check the Line Number: The console will usually link directly to the problematic line. Click it!
Use
console.log()Liberally: The oldest trick in the book is popular for a reason. Placeconsole.log(variableName)before the error line to see what the value actually is versus what you think it is.The Trusty Debugger: Don't be intimidated by the "Sources" tab in your browser's DevTools. Setting a breakpoint lets you pause your code and inspect every variable at that moment in time. It’s like a time machine for your code's state.
Rubber Duck Debugging: Explain your code, line by line, to a rubber duck (or a patient colleague, or even your dog). The act of verbalizing the problem often forces your brain to see the obvious .